Org Signal
I built Org Signal as a browser-based environment for teaching and conducting social network analysis. It supports network construction, visualization, measurement, comparison, simulation, and analysis across hand-built networks, survey data, synthetic organizations, published datasets, and empirical communication records.
Org Signal lets a researcher or learner draw a network by hand, build an ego network, survey a class or team, generate organizations with known structure, work through classic published networks, and import empirical data from communication, calendar, survey, messaging, and social-platform records. The same environment can then be used to inspect ties, compare measures, identify brokers and communities, examine change over time, and export networks, figures, tables, and methods documentation.
The analysis engine is built for research use. Its network measures have been validated against NetworkX, exact linear-algebra calculations, and closed-form reference cases across roughly 21 million comparisons, with no unexplained failures in the current validation campaign. Statistical procedures are calibrated by simulation, generated networks are tested end to end through the same import pipeline used for empirical data, and the included classic datasets reproduce published values.
Everything runs in the browser, and files you load remain on your device. With an Anthropic, OpenAI, or Gemini API key, you can also use the built-in Ask interface to explore a network conversationally, ask about particular people or ties, interpret measures and comparisons, and draft summaries or reports from analyses Org Signal has run. The language model works from results produced by the analysis engine, and numerical claims in its responses are linked back to those results.
When Ask is enabled, Org Signal sends the model provider only the information needed for the request. This can include analysis results, names unless you replace them with codes, and short excerpts from underlying records when a question requires examining the evidence behind a tie. The original files remain in the browser. The API key is kept for the session unless you ask the browser to remember it.
Ways to work with a network
Draw a network
Place people and ties directly on a canvas, change the structure, and see how the measures respond. Worked examples provide small networks with known features such as brokers, cohesive groups, and isolates. Drawing networks is useful both for learning the measures and for working through structural ideas directly before moving to empirical data.
Build an ego network
A guided interview records who someone knows, how those people are connected, and attributes of the people and relationships involved. The resulting network can be examined using measures such as size, density, brokerage, constraint, and effective size.
Survey a class or team
Create a roster-based network survey and share it by link. Each participant completes the survey in their own browser and returns a response file. The files can then be combined into a single network for analysis.
Generate a network with known structure
Create synthetic organizations or online communities with specified departments, brokers, silos, reorganizations, departures, communities, or diffusion processes. Because the underlying structure is known, the resulting network can be compared directly with what was planted.
Work with a published network
Load classic datasets such as Zachary’s karate club, Padgett’s Florentine families, Krackhardt’s high-tech managers, Sampson’s monastery, Davis’s Southern Women, or the Enron email network. Each includes its source, the substantive result associated with the original study, and reference values that can be checked within the tool.
Analyze empirical records
Import communication, calendar, survey, messaging, social-platform, or standard network data. The import review describes the records available, the ties that can be constructed from them, and the limits of the resulting network.
Constructing networks from records
Empirical network data often begin as events rather than ties. An email archive contains senders and recipients. Slack contains replies, mentions, reactions, and channels. Calendars record co-attendance. Surveys record reported relationships. Each source provides a different set of observations from which a network can be constructed.
Org Signal keeps the rules that turn those observations into a network visible throughout the analysis. Replies, mentions, recipients, co-presence, reactions, declared ties, broadcast thresholds, weights, and filters can be changed independently. The system reports how each rule contributes to the resulting network, so an analyst can see how a particular construction follows from the underlying records.
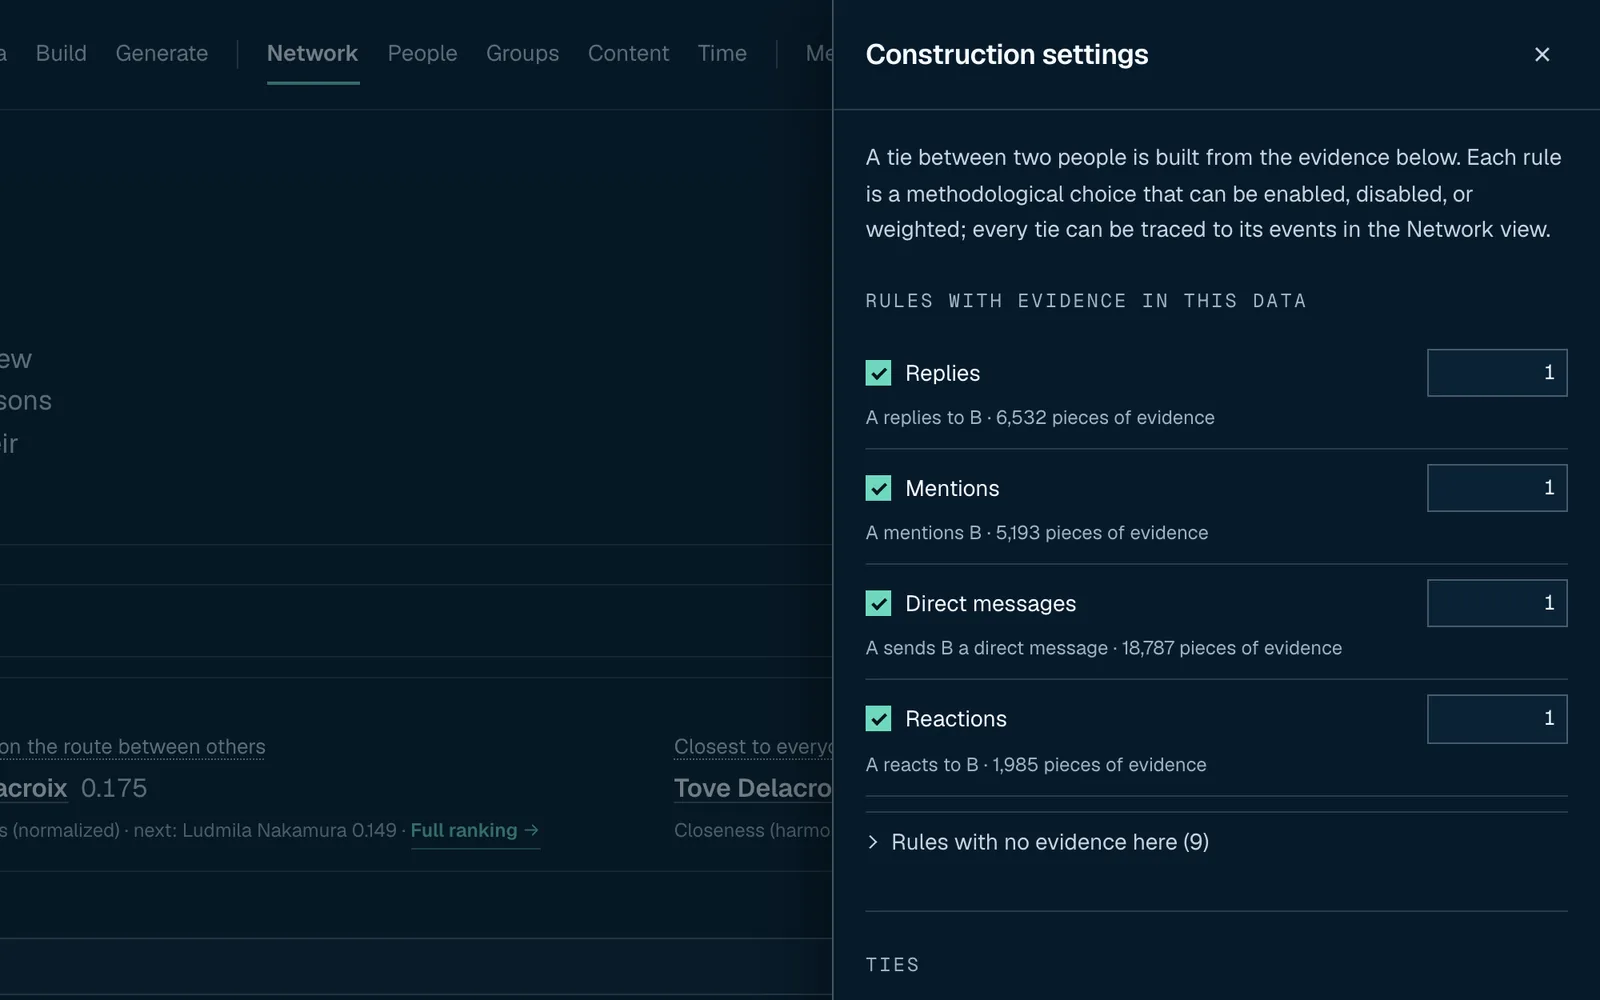
Each rule used to construct ties can be inspected and changed.
Individual ties remain linked to the records that produced them. Selecting a tie shows the underlying events, making it possible to examine the empirical basis for the relationship represented in the network.
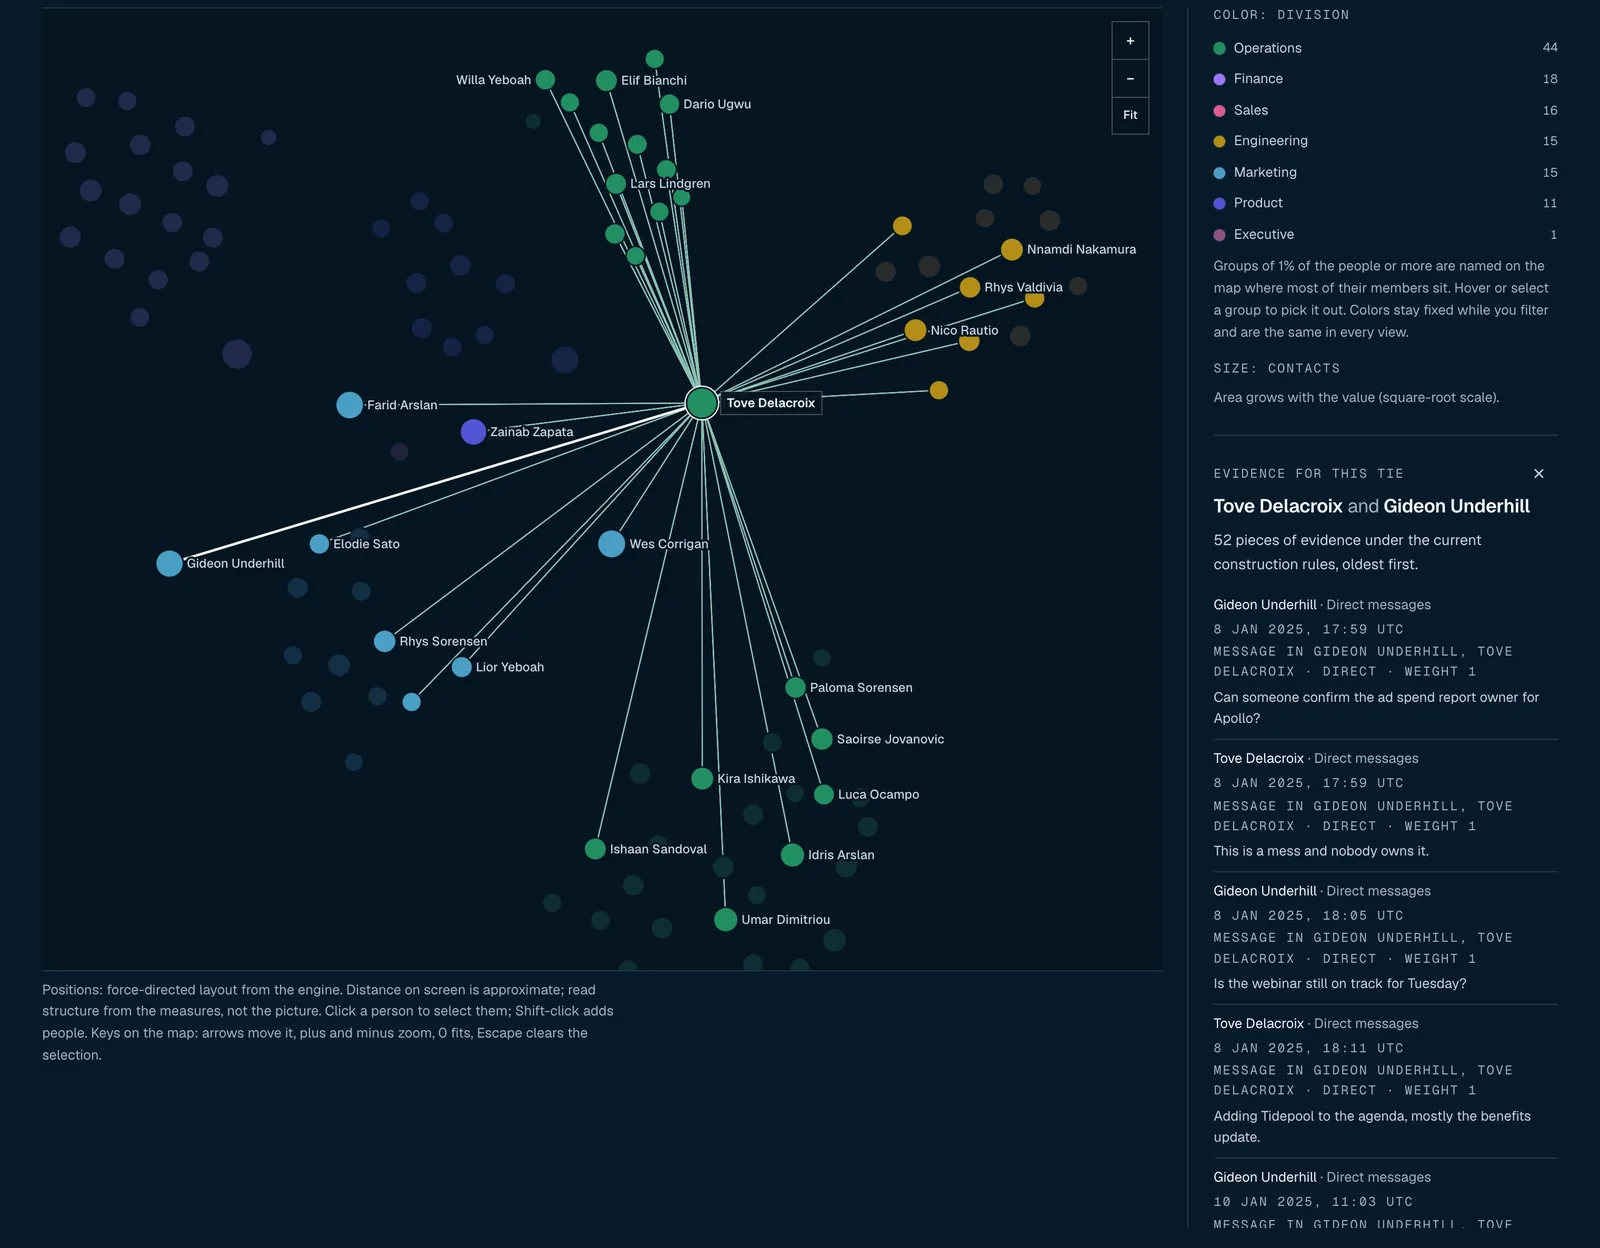
A selected tie shown alongside the records from which it was constructed.
Before analysis begins, the import review summarizes what was found in the data, how the records can be used to construct ties, and what the source can reasonably support.
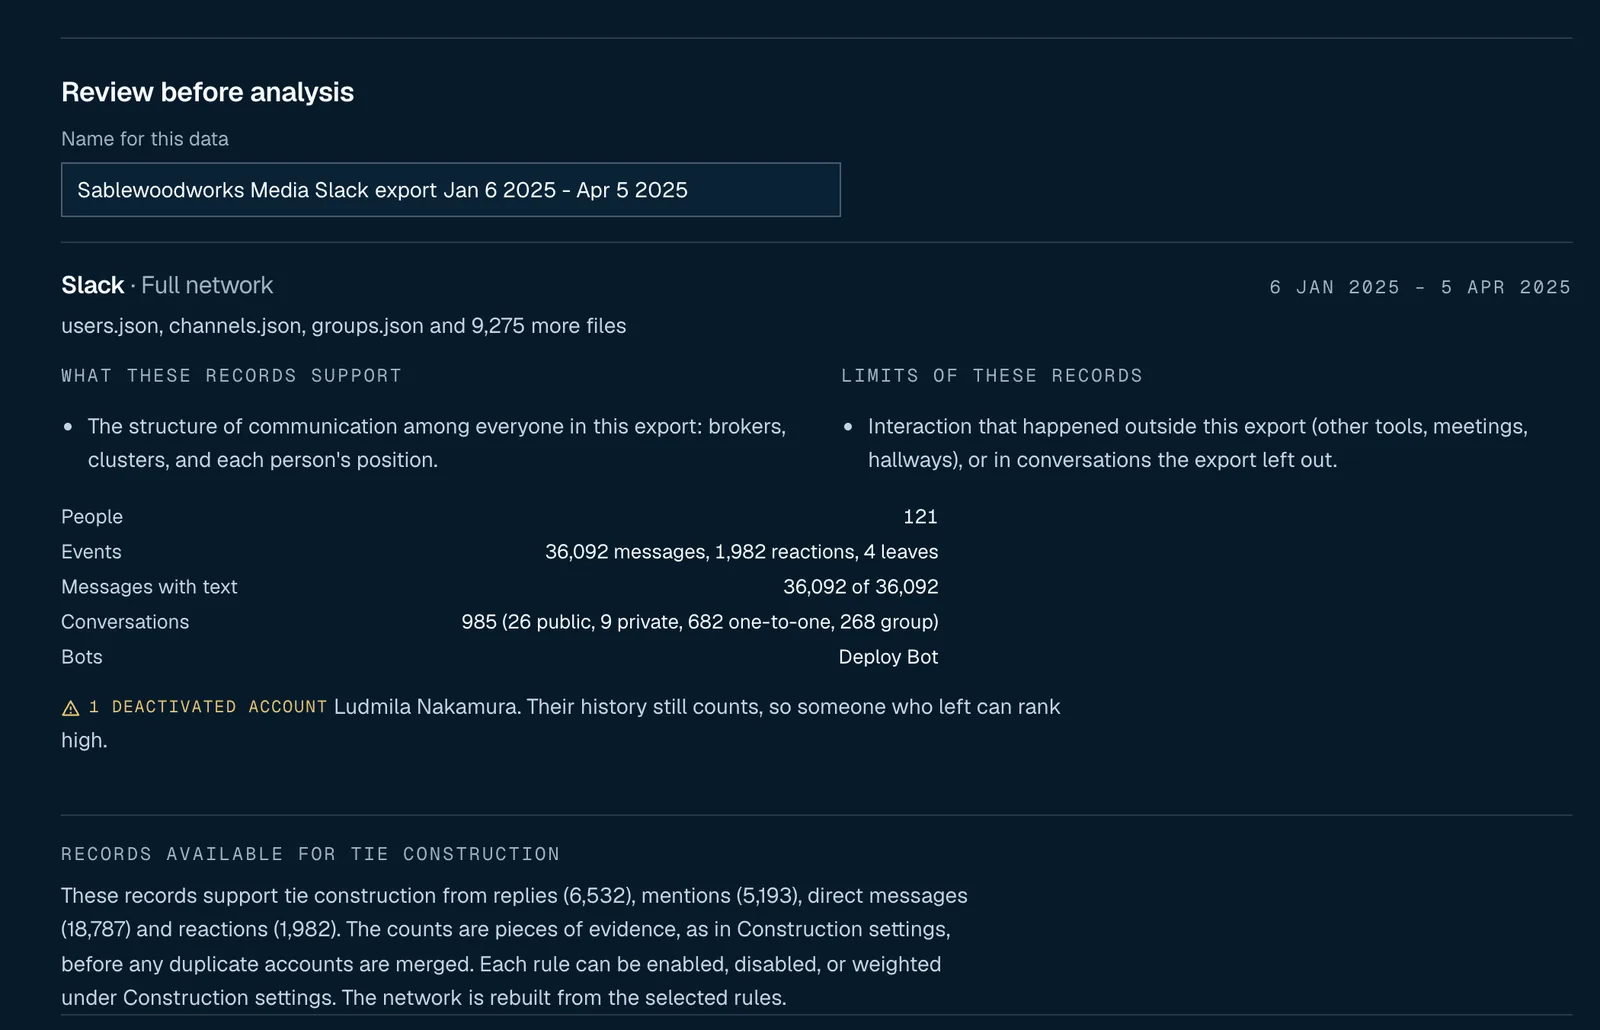
The import review describes the observations available in the source and the limits of the resulting network.
Org Signal currently supports workplace communication, calendars, messaging platforms, social archives, surveys, standard network formats, and ordinary who-to-whom tables. These include Slack, email, calendar files, WhatsApp, iMessage, Telegram, Messenger, Instagram, Discord, Reddit, X, Bluesky, Mastodon, Threads, LinkedIn, GraphML, GEXF, GML, Pajek, UCINET DL, Gephi tables, Network Canvas, and roster surveys.
Working with known structure
Small networks provide a direct way to examine how network measures respond to structure. A worked example might contain two groups connected through a single broker. The broker can be identified visually before any calculation is run, allowing the resulting betweenness score to be interpreted against a structure already understood.
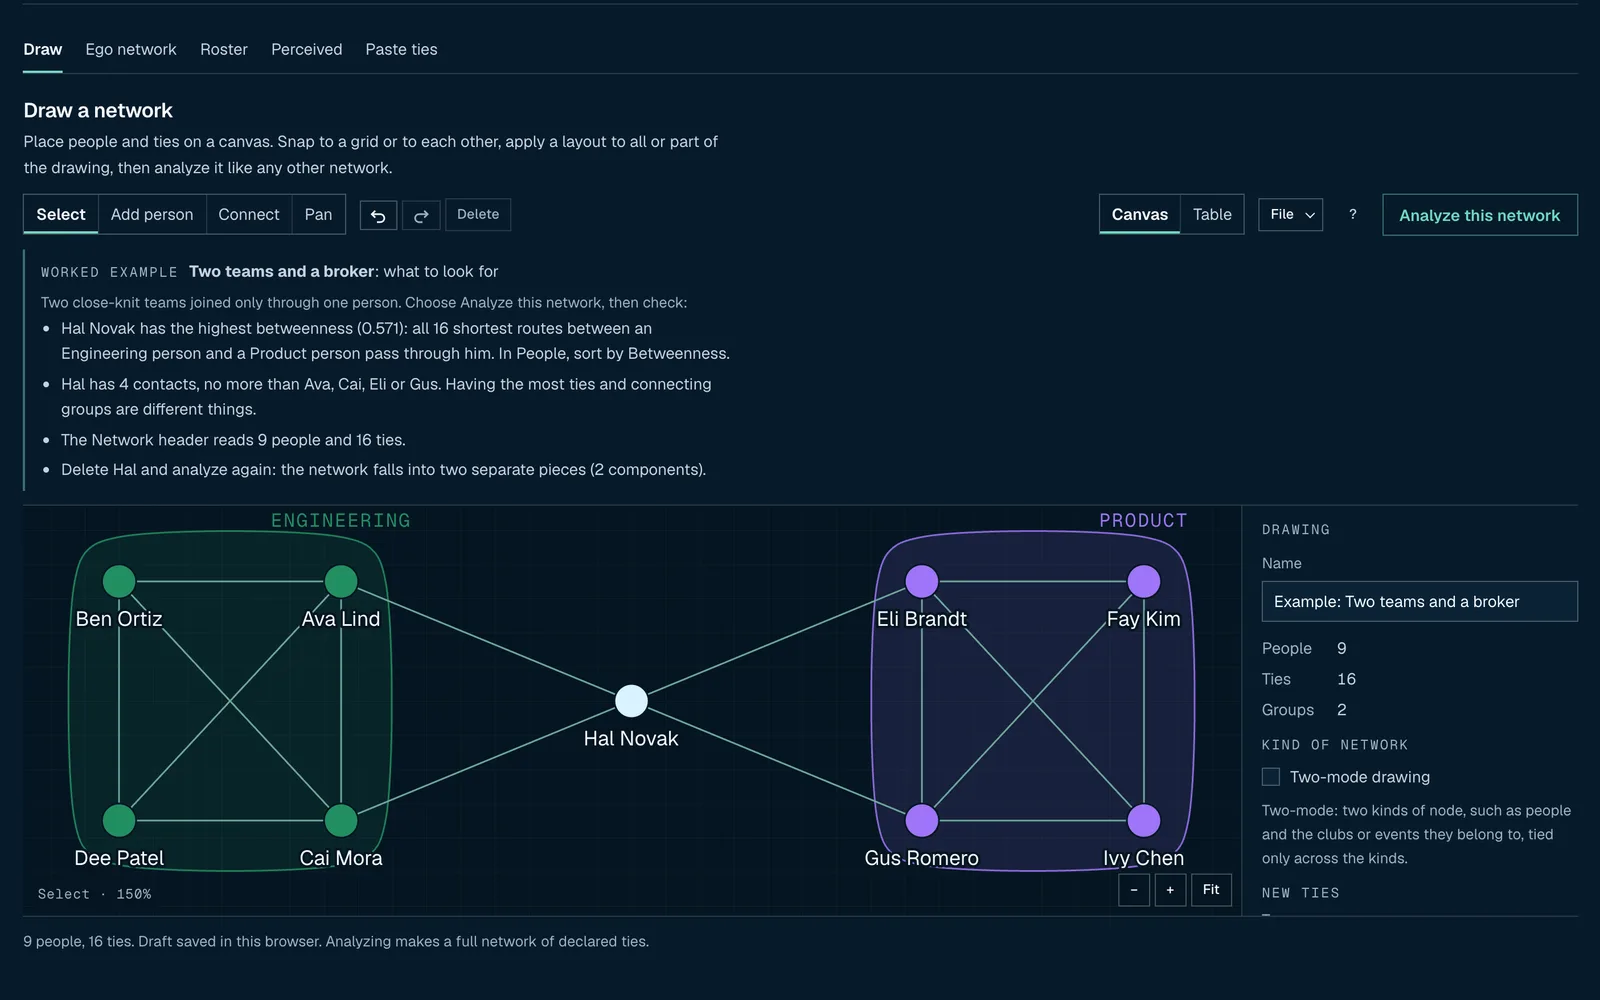
Two groups connected through a single broker.
Synthetic networks extend the same approach to larger and more realistic systems. Org Signal can generate organizations and online communities with specified departments, brokers, silos, reorganizations, departures, communities, and diffusion processes. The generated social system is then observed through a simulated communication medium and written into the kinds of export files produced by empirical platforms.
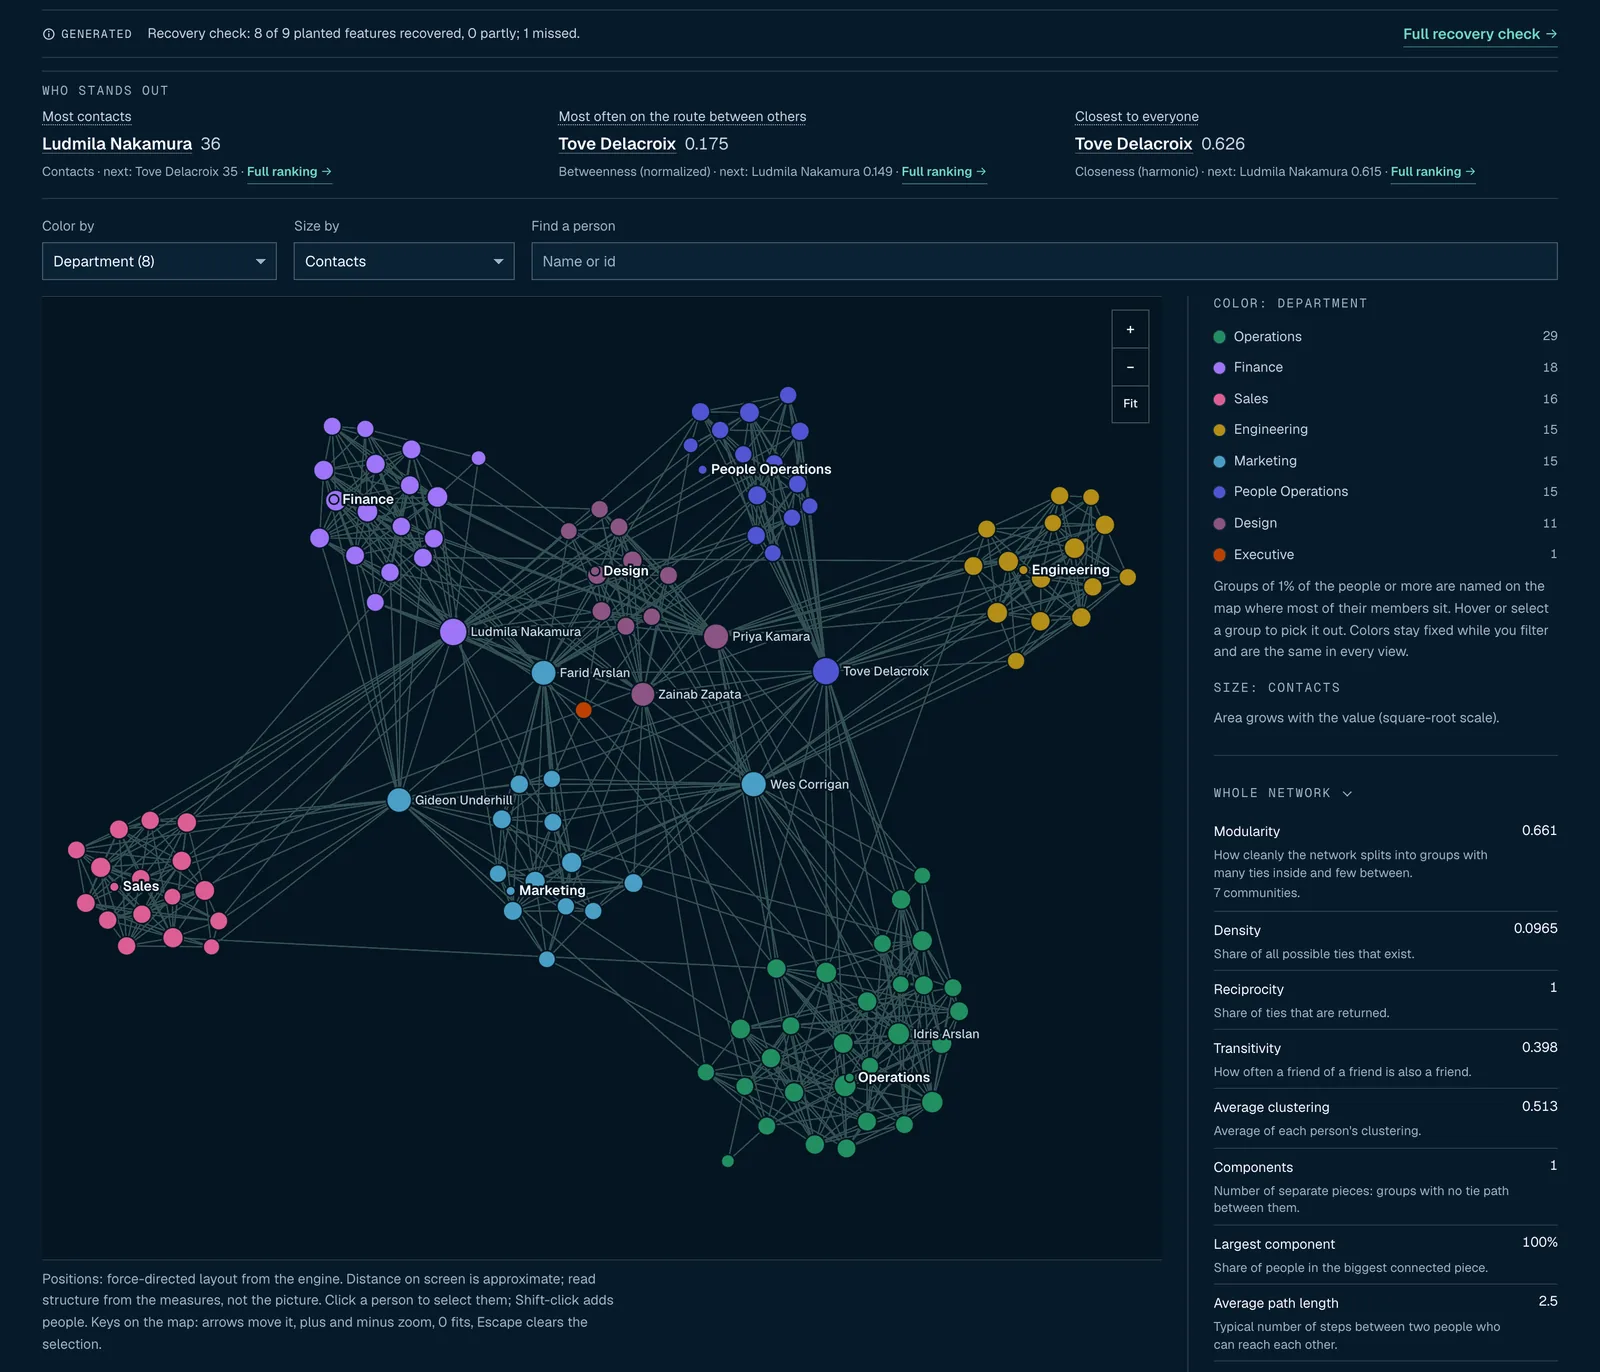
A generated organization of 120 people, with departments and structural features specified during generation.
Those files are read back through the same importers used for empirical data. The recovery analysis then compares the reconstructed network with the structure used to generate it. Community detection can be evaluated against planted departments, brokerage measures against known brokers, and reconstructed ties against the underlying network.
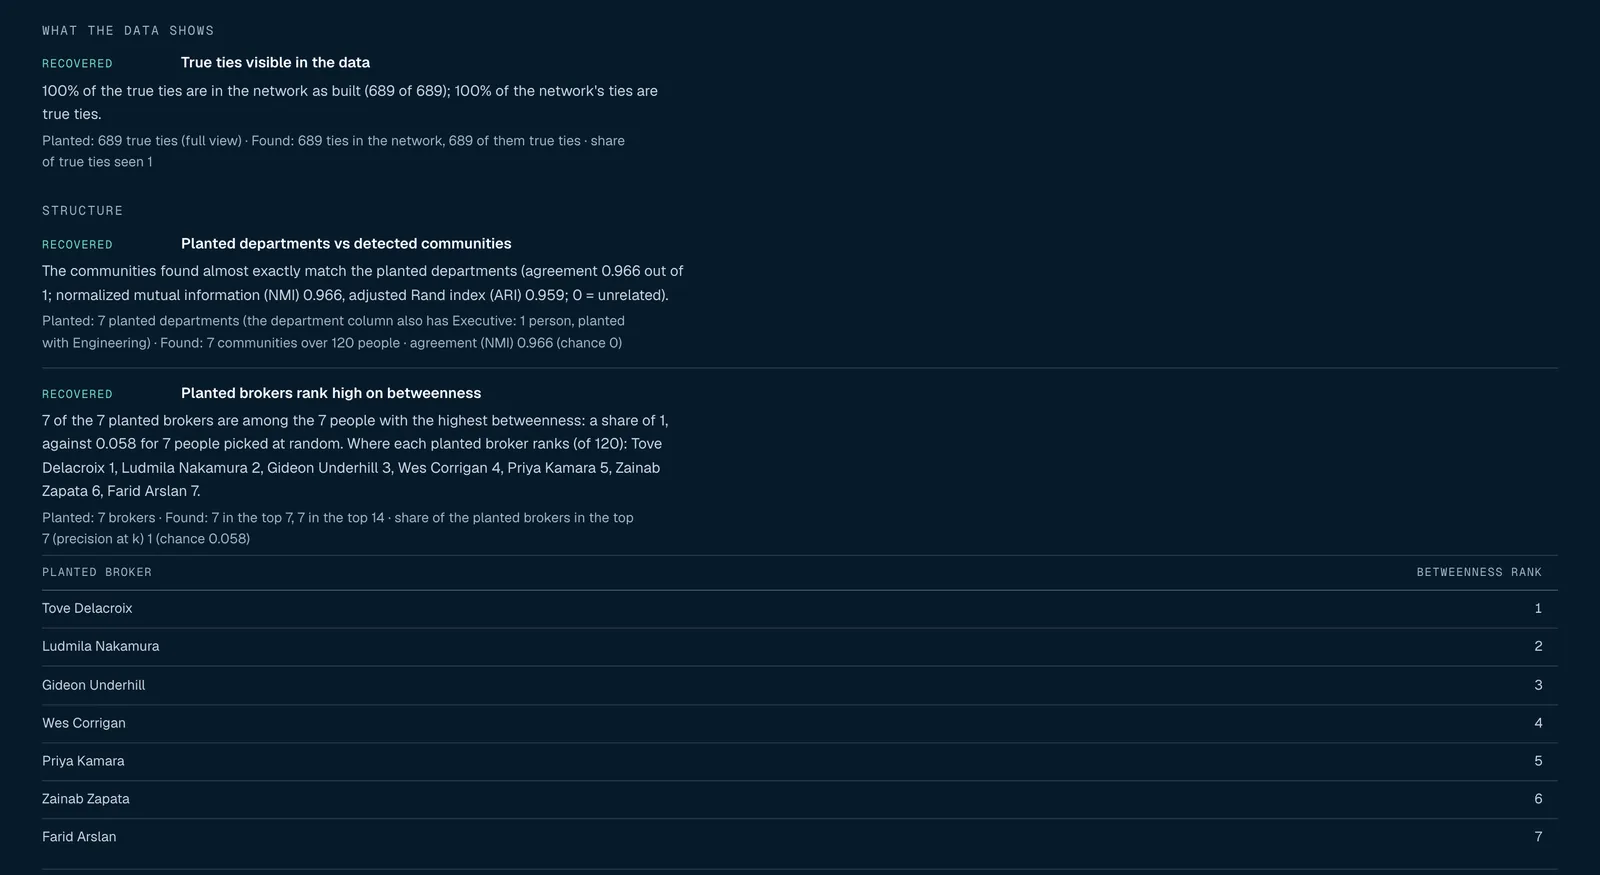
In this example, all seven planted brokers occupy the top seven positions in the betweenness ranking.
The classic datasets provide a second form of reference. They allow analyses to be compared with published networks whose principal structural features, counts, or substantive findings are already documented. Together, the hand-built, synthetic, and published networks provide several ways to check interpretation before applying the same measures to less transparent empirical data.
Analysis
Org Signal calculates node-level and whole-network measures including degree, betweenness, closeness, eigenvector centrality, PageRank, constraint, effective size, density, community structure, mixing, and two-mode measures.
It also supports comparisons with degree-preserving random networks, rank uncertainty from resampling, before-and-after comparisons, shift detection, and analyses of content and term diffusion.
Results are presented alongside the relevant network structure and explanatory material. A centrality ranking, community assignment, or statistical comparison can therefore be examined in the context of the network from which it was calculated.
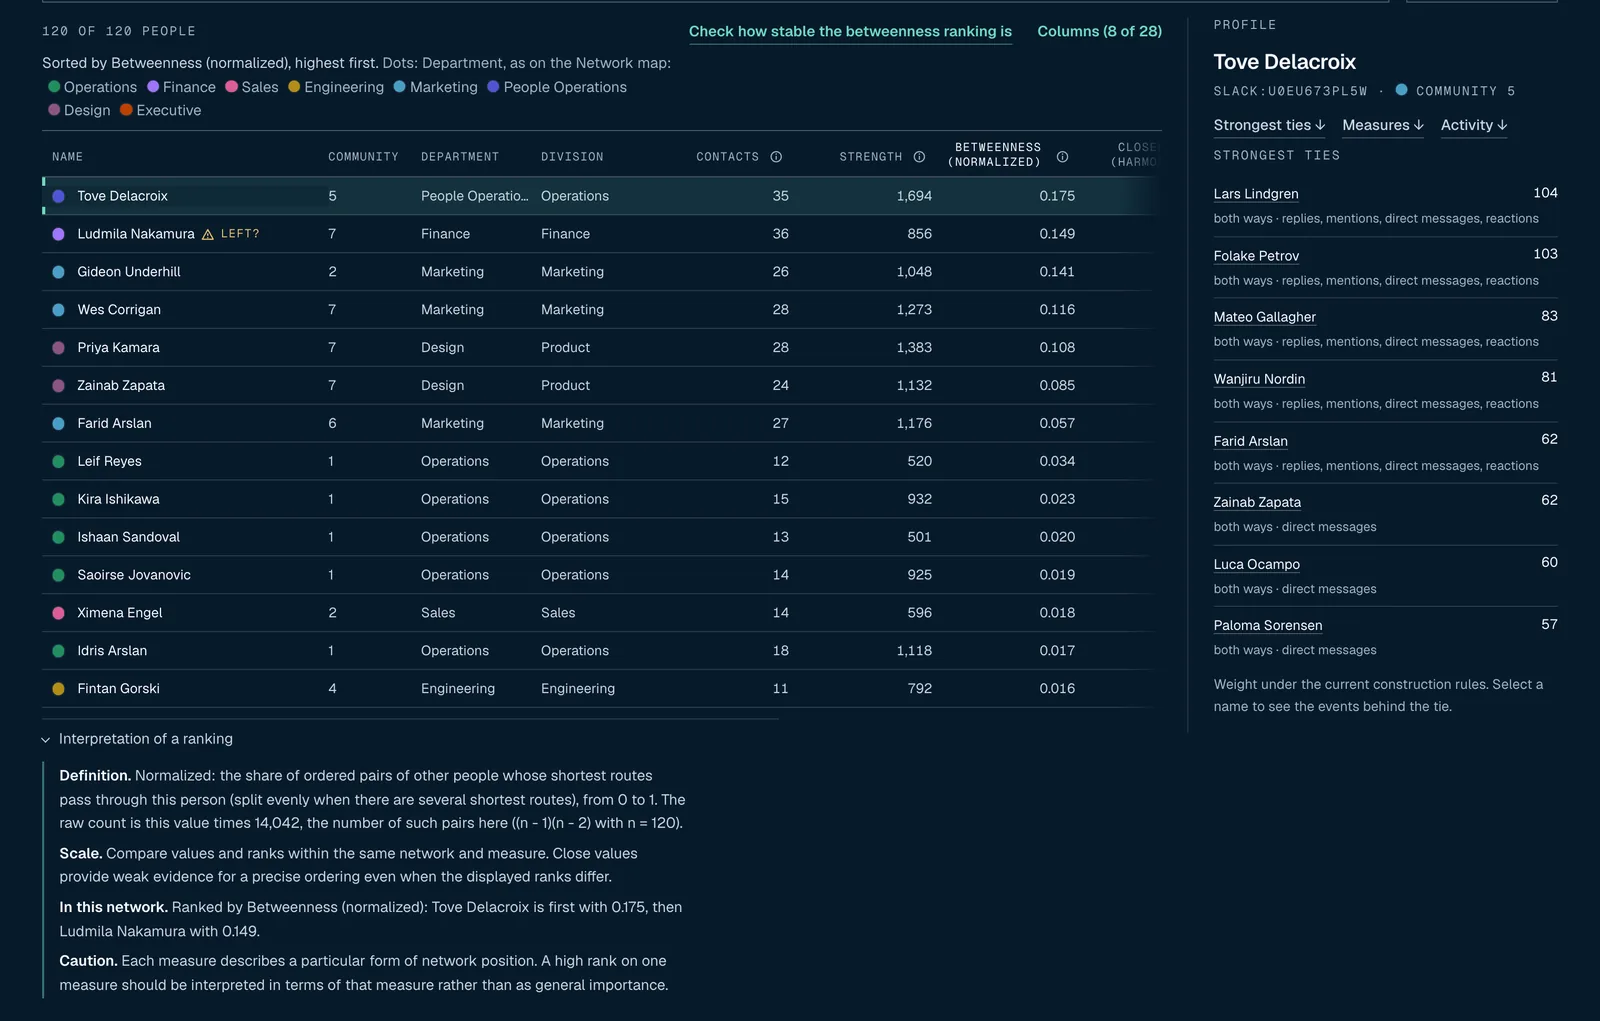
A betweenness ranking shown alongside the corresponding network and an explanation of the measure.
The analysis remains connected to the underlying observations where the source data allow it. Analysts can move from an aggregate result to an individual actor or tie, and from a tie back to the events used to construct it.
Network files, metric tables, figures, summary reports, and methods documentation can be exported. The methods appendix records the analyses that were run and the settings used to produce them, providing a record of the analytical sequence behind a result.
Teaching
The teaching materials follow the same progression used elsewhere in the system. Students can begin with networks they construct directly, move to generated and published networks with known structure, and then work with empirical records whose construction requires substantive decisions.
A sequence of twelve Networks 101 assignments begins with drawing a network and interpreting basic measures. Later assignments introduce ego networks, brokerage, communities, synthetic data, network comparison, uncertainty, and empirical network construction. The final project requires students to justify the construction of a network, analyze it with multiple measures, and make a statistical comparison.
The Learn section explains measures where they are used and includes worked examples and guidance on where to find the relevant results in the interface. Those explanations can be turned off as students become more familiar with the material.
Class surveys can be conducted through links. Each participant completes the survey in their own browser and returns a response file, which the instructor combines locally. This makes it possible to collect and analyze a classroom or team network without maintaining a central survey server.
Validation
The numerical implementation has been tested against NetworkX, exact linear-algebra calculations, and closed-form reference results.
The current validation campaign includes approximately 21 million comparisons across thousands of random and structured graphs, two-mode networks, content measures, and network export round trips, with no unexplained failures.
Statistical procedures are calibrated through simulation. Tests based on degree-preserving randomization produce approximately the expected false-positive rate under the null. Bootstrap rank intervals have also been evaluated against known ranks across repeated simulations.
The synthetic-data pipeline is tested end to end. Generated organizations are written to the native export formats used by the simulated communication systems and then read back through the production importers. Reconstructed events and networks are compared with the structures from which they were generated. This tests the sequence from the underlying social structure through observation, export, import, network construction, and analysis.
The included classic datasets reproduce published counts and reference values.
These checks address numerical and implementation accuracy. Substantive validity depends on the relationship between the observed data, the rules used to construct the network, and the theoretical quantity being studied. The import review, tie-construction controls, and source-level inspection provide the information needed to evaluate those decisions.
Current limitations
Org Signal is new research software. Usability testing to date has used simulated student and instructor workflows rather than a live course. Automated browser testing currently focuses on Chrome, with less systematic testing in Safari and Firefox.
Some importers were developed from published platform specifications and public sample files and have not yet been tested extensively against real user exports. Microsoft Teams and LinkedIn are among the least-tested formats. Platform export formats can also change over time.
For networks above approximately 3,000 nodes, some computationally intensive measures are estimated by sampling. These approximations perform best when structural differences are large. Their rankings become less stable when scores are closely clustered or when networks are sparse, directed, or strongly tree-like.
The synthetic-data recovery checks also vary by context. Workplace and online-community structures are generally recovered well, while some professional, calendar, Discord, and bot-campaign scenarios remain more difficult. The recovery analysis reports these differences directly.
Personal platform exports also impose limits on inference. An archive belonging to one person records only the portion of the network visible from that account. Measures calculated from such records describe the observed network represented in the export.
Additional limitations and implementation details are maintained in the documentation.
Documentation
- Guide, data handling, and known limitations
- Classic datasets: sources, conversions, and checks
- Supported data formats
- Accuracy report
- Networks 101 assignments
- Source code
- Report a problem
Suggested citation
Gladstone, E. (2026). Org Signal: Browser-based network analysis for teaching and research (Version 2.0) [Software].